Sports Analytics Video Technology
Written by Paul Richards on February 18, 2025
Improving Your Team With Sports Analytics
Sports analytics doesn’t have to be complicated or require expensive technology. Whether you’re a coach, player or team analyst, you can begin enhancing your game strategies with tools as simple as pen and paper. As you become more comfortable, you can gradually incorporate more advanced methods to take your analysis to the next level.
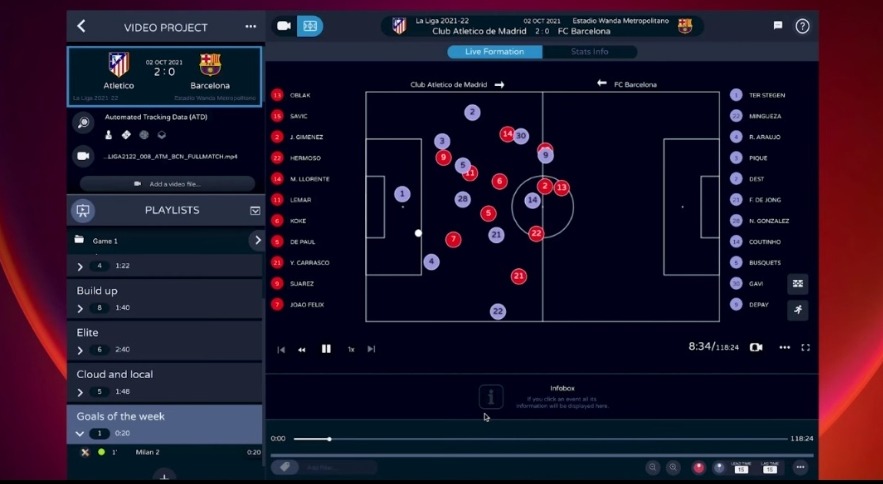
Metrica sports provides insightful graphics and statistics via their software platform.
The Role of Video in Sports Analytics
Sports analytics, at its core, is about transforming raw data into actionable insights. This data is traditionally collected through metrics like player statistics, scoring patterns and game outcomes. However, when combined with video, the scope of analytics can expand exponentially.
Starting with Low-Tech Solutions
You don’t need high-end systems to begin using sports analytics. Even these low-tech solutions can help you improve your video editing workflow by simply notating the time of keyplays and other analytics you are tracking. Here’s how you can start with simple, low-tech tools:
- Pen and Paper Scorekeeping
- Keep track of scores, player statistics and key moments during games.
- It’s easy to set up and doesn’t require any special equipment. You can quickly jot down important details that can be reviewed later.
- Basic Notebooks
- How It Helps: Record observations about player performance, team formations and strategies.
- Why It’s Good: Having a dedicated notebook allows you to organize your thoughts and track progress over time.
- Simple Spreadsheets
- How It Helps: Use programs like Excel or Google Sheets to log data such as scores, player stats and game outcomes.
- Why It’s Good: Spreadsheets are user-friendly and can help you identify patterns and trends without needing advanced technical skills.
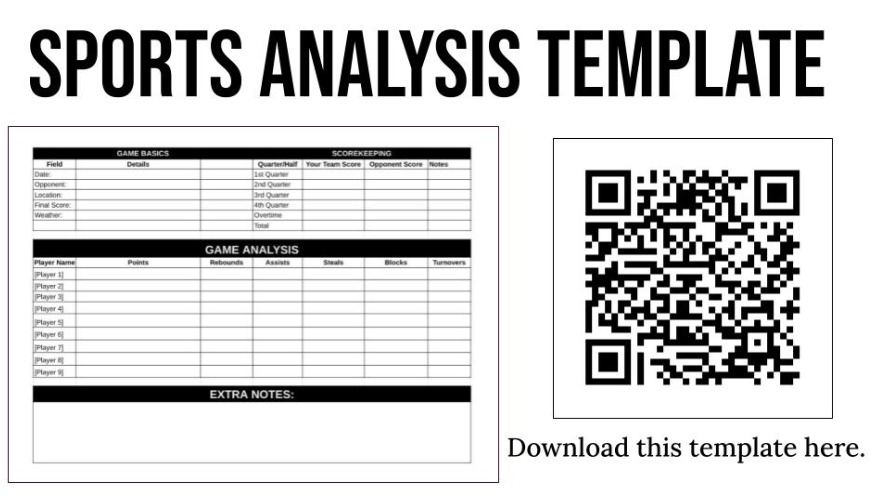
Simple Sports Analytics Template
Gradually Incorporating Technology
As you become more comfortable with basic analytics, you can start introducing more advanced tools to enhance your analysis:
- Video Recording
- Capture games and practices to review plays, study formations and analyze player movements.
- Visual footage allows for a clearer understanding of what happened during the game and helps in providing concrete feedback.
- You can synchronize your notes to the video footage by starting a stopwatch (on your smartphone) at the same time the recording starts and logging the stopwatch time with every note. As long as the recording doesn’t stop, this loose synchronization will remain intact. If you’re using a higher end system that records timecode and can set the timecode generator to “time-of-day” timecode or free-run timecode (set manually to match the time-of-day) then you can use your watch or phone’s clock – even if the recording is paused and restarted.
- Simple Analytics Software
- Use affordable software to organize and visualize your data, such as creating charts or tracking player performance over time.
- Software tools can automate some of the data analysis, making it easier to draw meaningful conclusions.
- Dig deeper into analytics that you can’t capture during the game.
Building Your Analytics Toolkit
Here’s a step-by-step approach to developing your sports analytics system:
- Start with What You Have
- Begin by using pen and paper or a simple notebook to record basic information during games and practices.
- Organize Your Data
- Use spreadsheets to input and organize the data you’ve collected. This can include scores, player statistics and key events.
- Review and Reflect
- Regularly review your notes and spreadsheets to identify strengths and areas for improvement. Discuss these findings with your team.
- Incorporate Video Analysis
- Start recording games and practices. Use the footage to provide visual feedback and deeper insights into your team’s performance.
- Advance to Digital Tools
- As your needs grow, explore more advanced analytics software that can help you create detailed reports, heat maps and player path analyses.
Benefits of Starting Simple
- Low-tech solutions are easy to implement and don’t require significant upfront investment.
- Simple tools are straightforward and can be used by anyone, regardless of their technical expertise.
- Starting with basic methods allows you to adapt and expand your analytics system as your team’s needs evolve.
- You can always expand the areas of your game that you want to track using video as your source of data.
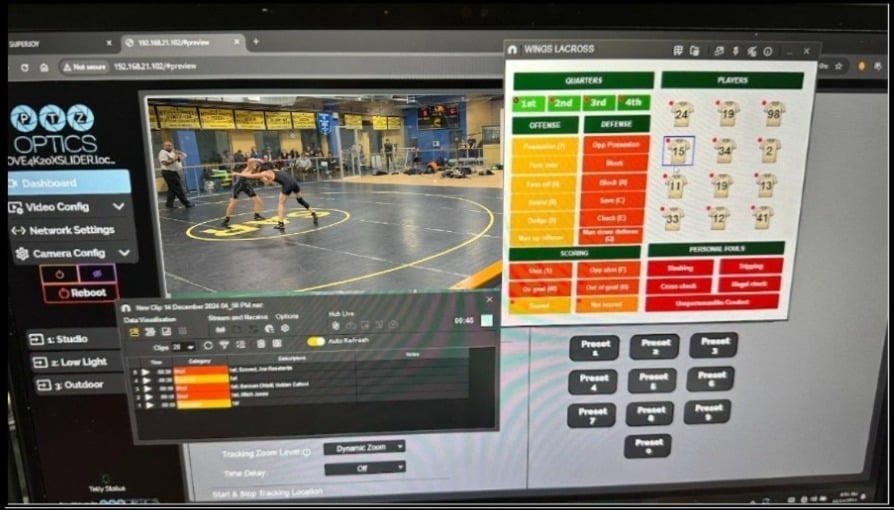
Live tagging during a sports game can generate useful analytics and reduce time spent editing recorded video.
Sports Analytics: Defining Key Performance Indicators (KPIs)
When incorporating sports analytics into your video production workflow, defining the right KPIs is essential for maximizing team performance. The key is collaboration between coaches, analysts and video producers to determine which statistics will have the most meaningful impact on strategy, training and player development.
How to Define KPIs for Your Team
Here’s a step-by-step guide for defining KPIs in sports analytics:
1. Understand the Team’s Goals
Start by clarifying the team’s overarching objectives:
- Are you focused on improving offensive or defensive performance?
- Is player development a priority or are you more concerned with in-game strategy?
- Do you need real-time stats for coaching adjustments during games?
2. Collaborate with Coaches and Players
The coaching staff and players have firsthand experience with the game’s nuances. Ask these questions:
- What stats would help you better understand team strengths and weaknesses?
- What specific events or moments should be tracked in-game?
- Which player actions or plays determine the game’s outcome most frequently?
3. Select Relevant Metrics
Choose KPIs based on the sport’s critical performance factors. Here are some common examples by sport:
- Basketball: Points per possession, shooting percentage, turnovers, player efficiency rating (PER).
- Soccer/Football: Shots on goal, pass completion rate, expected goals (xG).
- Baseball: Batting average, on-base percentage, earned run average (ERA).
- Hockey: Save percentage, face-off win percentage, goals against average.
- Tennis: First-serve percentage, unforced errors, net points won.
4. Make KPIs Actionable
Choose KPIs that can inform real coaching decisions. Metrics should be specific, time-bound and player-focused where possible. For example:
- “Defensive rebounds per game” informs defensive adjustments.
- “Passing accuracy in the final third” can improve attacking strategies in soccer.
5. Use Video to Support Analysis
Combine video footage with tracked KPIs. Consider these approaches:
- Use slow-motion replays to review key plays.
- Tag and catalog plays by action type, allowing for post-game review.
- Overlay stats on video footage during playback for context.
Checklist for Defining KPIs:
- Clearly defined team goals
- Collaboration with coaching staff
- Key moments and actions identified
- Real-time vs. post-game analytics needs
- Player-specific vs. team-wide KPIs
- Video integration for visual review
- Historical data for trend analysis
Example KPI Questions by Sport
Basketball Example:
- Are we winning the rebound battle consistently?
- How effective are we in transition defense?
- Which lineups produce the highest scoring runs?
Soccer/Football Example:
- Are we completing passes in dangerous areas?
- How often are we creating goal-scoring opportunities?
- Are players tracking back effectively on defense?
Baseball Example:
- Is our pitching rotation maintaining a consistent ERA?
- Are our batters hitting against left-handed pitchers effectively?
- How efficient is our base-running?
By defining KPIs using these steps, sports teams can transform raw game footage into actionable insights that fuel player development, improve in-game decision-making and drive long-term success.
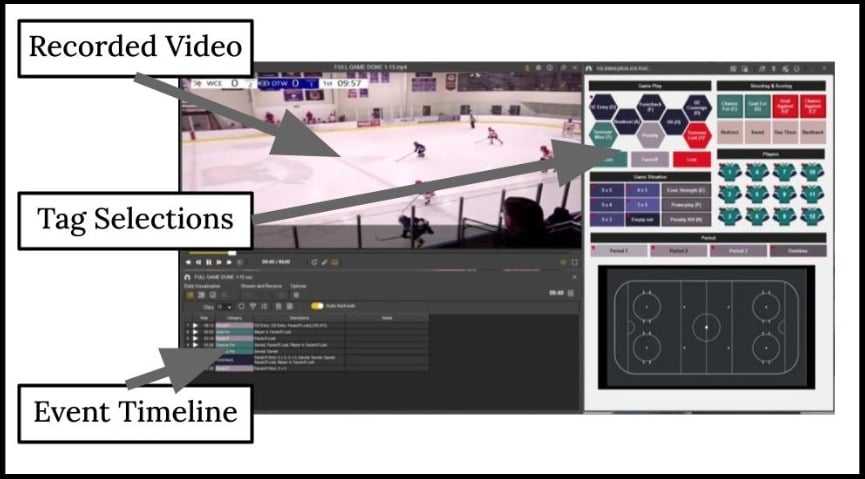
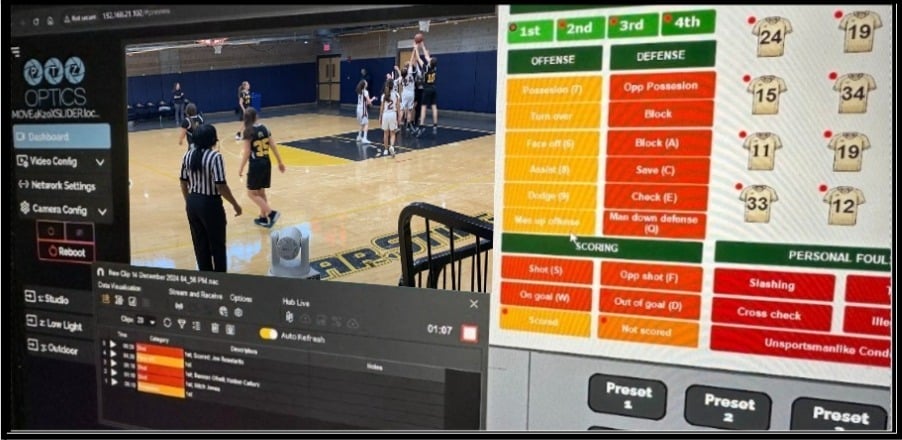
NACSPORT is used to produce sports analysis from recorded video.
Presenting Data Effectively: Turning Numbers into Actionable Insights
The integration of video technology into sports coaching has become a fundamental component at every competitive level, providing a strategic edge that extends beyond conventional methods of instruction. High-quality footage can reinforce verbal and on-field directives, highlight key moments and formations and serve as an objective source of performance data for evidence-based coaching decisions. Yet, the mere act of recording does not ensure that players will understand and benefit from the information captured. Effective communication depends not only on the technical quality of the footage but also on how the content is presented, contextualized and connected to the athletes’ roles and responsibilities within the game.
Achieving this level of clarity requires drawing on principles from the science of learning. Coaches who consider cognitive load, motivation and retention strategies can create an environment in which data and visuals become meaningful rather than overwhelming. The goal is to translate raw metrics and video segments into a clear narrative that players can internalize and apply on the field. In other words, it’s not enough to show a player their shot chart or passing accuracy; the key is guiding them to understand what these indicators mean for their positioning, decision-making and future performance. By combining the strengths of modern videography with evidence-based communication strategies, coaches and analysts can ensure that every frame of footage and every piece of data contributes to ongoing development and tangible competitive gains.
“Video enables discussion, reflection and visualization and I believe it is the most powerful tool sports coaches have to support the delivery of feedback and performance information to athletes.
Translating performance statistics from data into wisdom, supplemented with video evidence should be something every coach seeks to utilize in their practice at any level of sport, helping their teams and athletes unlock their full potential.”
-Darren Lewis, Director Codex Analysis.
Here are strategies and scientific principles for presenting data so that it resonates with athletes:
- Provide Context and Relevance
- Contextualize the Metric: Instead of just stating a KPI like “Your passing accuracy is 82%,” add context by comparing it to a target benchmark or a league average. For example, “Your passing accuracy is 82%, which is just below the league average of 85%. Closing that gap by focusing on shorter, safer passes in high-pressure areas could create more scoring opportunities.”
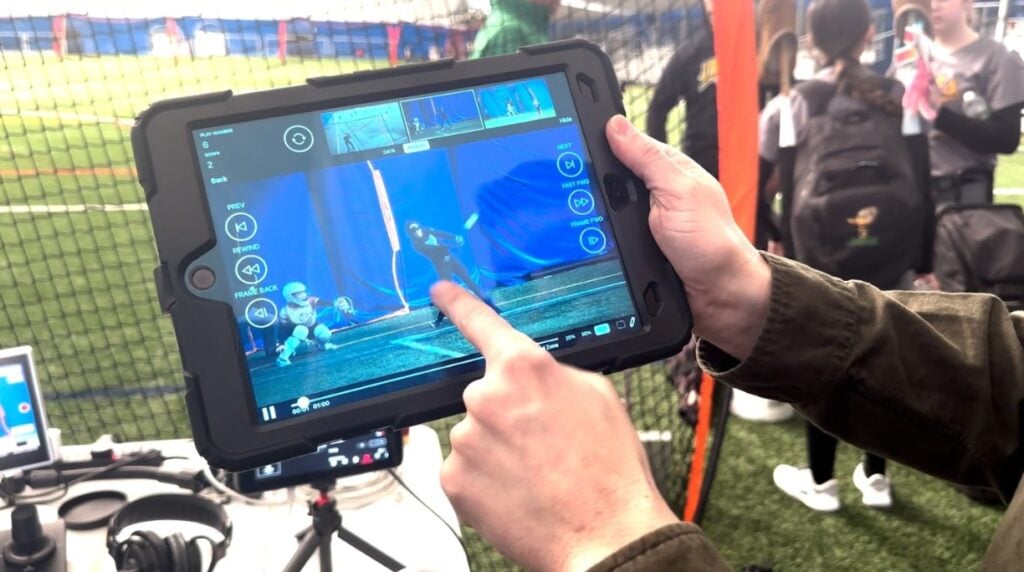
- Link to Game Situations: MySkyCoach is a great tool you can use to create and tag live video clips and deliver them to a wireless tablet in the hands of a coach. By tagging the video, you can quickly filter through video clips and review gameplay moments live or at a halftime break. Giving coaches the ability to pause, rewind and replay moments in slow-motion has become much easier with touch screen tablets. This connection between numbers and real-world scenarios helps the athlete visualize how to adjust their decisions.
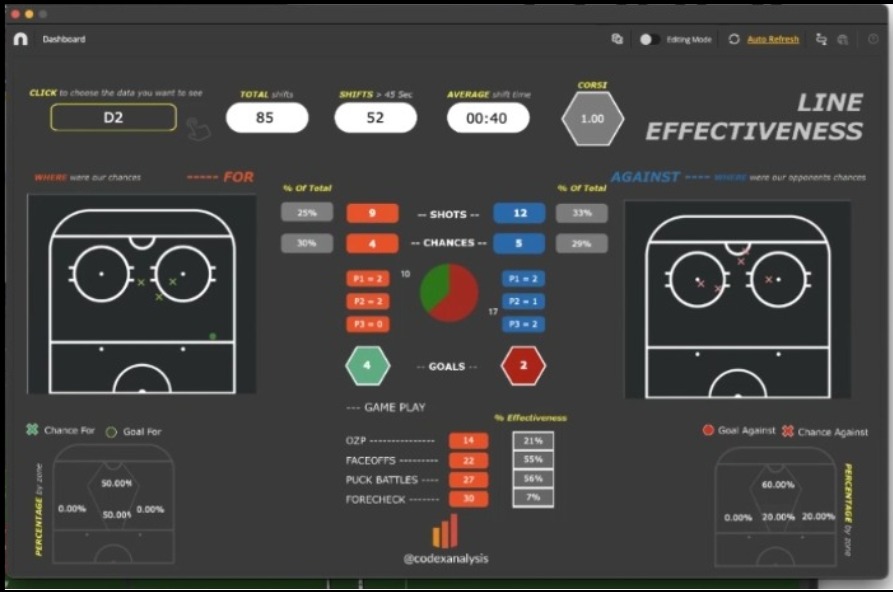
Line effectiveness charts built by Codex Analysis using Nacsport.
- Use Visual Aids Wisely
- Simplicity in Visualization: Charts and diagrams should be easy to read. Highlight key figures with contrasting colors or callout boxes. Avoid cluttered dashboards with too many metrics at once.
- Before-and-After Comparisons: Show players how a slight change in technique or positioning impacted their stats over time. For instance, “Here’s your shooting accuracy before you adjusted your foot placement and here’s after,” tied directly to video clips for a visual cause-and-effect relationship.
- Relate Data to Player Roles and Responsibilities
- Role-Specific KPIs: Tailor data presentations to what the player needs to excel in their role. A central midfielder may benefit most from data on passing choices and interceptions, while a striker needs insights into shot selection and movement off the ball.
- Highlight Individual Strengths and Weaknesses: Emphasizing where the player excels can build confidence and buy-in. For example, “You’re already among the top three on the team for defensive rebounds—imagine how effective you’d be if you improve your defensive positioning by just 5%.”
- Incorporate Learning Science and Cognitive Principles
- Chunking Information: Cognitive load theory suggests that breaking information into smaller, manageable segments helps players process and retain it. Present data in short sessions focusing on one or two KPIs rather than overwhelming them with every metric at once.
- Guided Discovery: Players are more likely to retain information if they actively engage with it. Ask questions like, “What do you think might improve if you raised your passing completion rate in the final third?” Encouraging players to draw their own conclusions improves internalization.
- Storytelling and Narratives: Humans are wired to remember stories better than standalone facts. Frame the data as part of a narrative: “Last season, you struggled under high-pressure situations, but this year your decision-making speed improved by 10%. Let’s see how that helped us control the midfield during our last match.”
- Tie Data to Actionable Steps
- Action-Oriented Feedback: After presenting the data, give clear, specific instructions for improvement. Instead of “You need fewer turnovers,” say, “In pressure situations, try making your first pass simpler—look for the nearby midfielder instead of attempting a long diagonal.”
- Short-Term Goals: Setting immediate, quantifiable targets gives players something tangible to work toward. For instance, “In the next game, let’s aim for a 5% increase in successful tackles near the sideline.”
- Reinforce Through Repetition and Follow-Up
- Progress Tracking: Show players their improvement over several games or training sessions. This visualization of progress not only motivates them but also confirms that the data-informed strategy is working.
- Regular Check-Ins: Periodically revisit the KPIs and video highlights. Reinforcement through repetition helps players incorporate the changes into their muscle memory and decision-making patterns.
- Culturally and Individually Tailored Communication
- Player-Centric Language: Explain data in terms that resonate with the player’s understanding of the game. Some athletes respond best to data-driven logic, others to visual and narrative explanations. Tailor your approach accordingly.
- Cultural Sensitivity and Communication Styles: Some players may prefer direct, concise instructions, while others benefit from more conversational, exploratory discussions. Adapt how you present data to match individual learning preferences.
Example Scenario:
A soccer coach wants a winger to improve decision-making in the final third. After running analytics, the coach finds that the player’s pass completion rate in dangerous areas is lower than average, often due to overly ambitious forward passes against double coverage.
Step-by-Step Presentation:
- Contextualize the Data: “Your pass completion rate in the final third is 60%. The league average for a winger in your role is about 70%. Just closing that gap would create 2–3 more scoring chances per match.”
- Visualize with Video: Show a clip of a recent match. Freeze the frame at the moment the player makes a risky pass. Annotations can be used to highlight specific areas and draw athlete’s attention to specific areas.
- Relate to Role: “As our main wide attacker, finding the midfielder who can switch play inside will open space for your runs behind the defense. That’s your advantage—your speed is a real threat, so let’s use it by making a safer pass that leads to a give-and-go.”
- Chunk the Information: Focus only on passes in the final third this session. In a future session, address crossing accuracy or dribbling decisions.
- Actionable Steps: “In the next match, try aiming for two simpler passes back into the midfield when pressed. If we see that work, we’ll expand on that approach.”
Scientific Rationale:
- Cognitive Load Theory: By presenting only one or two metrics at a time, players are less mentally burdened, improving comprehension and retention.
- Self-Determination Theory (SDT): Involving players in interpreting their own data fosters autonomy and intrinsic motivation, making them more likely to adopt the suggested improvements.
- Visual Learning Principles: Intuitive controls such as “pinch and zoom” make visual learning and instructions more natural.
By using these methods—contextualizing stats, employing clear visualizations, tying data to specific roles and actionable steps and leveraging learning science—coaches can turn raw metrics into meaningful insights. This approach ensures that players don’t just see the data, but understand it, internalize it and apply it effectively in competition.
Join the StreamGeeks Community and Start Streaming Like a Pro By downloading Sports Video: Recording, Analysis, and Live Streaming, you’ll gain access to:- Proven techniques for live production success.
- The tools to engage and grow your audience.
- Insights that will transform your approach to live video.
Download Sports Video Here
You can purchase the paperback here. <>Sports Video Chapters
- Download Sports Video here
- Chapter 1: Intro to Sports Video here
- Chapter 2: The Power of Sports Video here
- Chapter 3: Recording Sports Video here
- Chapter 4: Sports Video Analytics here
- Chapter 5: Using wide angle tactical cameras for sports video here
- Chapter 6: How to make sports highlight reels here
- Chapter 7: Sports Video Essentials Level 1 here
- Chapter 8: Portable Sports Video Systems here
- Chapter 9: Sports Video Analytics Systems here
- Chapter 10: How to Live Stream Sports Like a Pro here
- Chapter 11: Setting Up Cameras and Sports Equipment for Different Sports here